Remote sensing
Soil-Adjusted Vegetation Indices in Sparse Crop Canopies
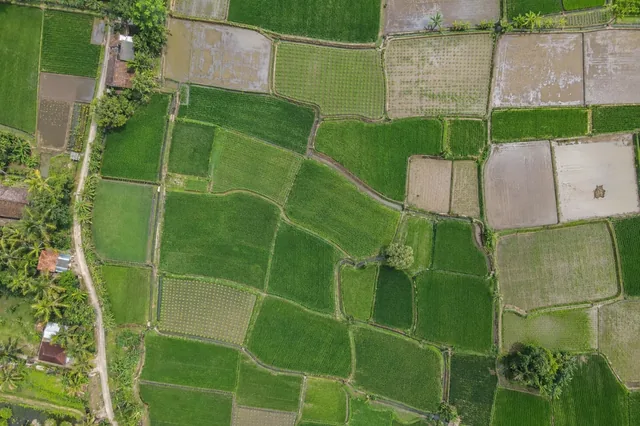
Sparse crop imagery contains a mixture of leaves, soil, residue and shadow.
5 min readRead article
THE DRONE COLLAB JOURNAL
Explore practical photogrammetry, GNSS, IMU, GIS and remote sensing methods. Technical explanations, worked examples and field checks for the people turning aerial photographs into usable maps.
Sparse crop imagery contains a mixture of leaves, soil, residue and shadow.
Red-edge indices use bands near the transition between red absorption and near-infrared reflectance.
NDVI combines near-infrared and red reflectance as their difference divided by their sum.
Sensor selection starts with the target observation.
Thermal imagery can reveal spatial differences in apparent canopy temperature when capture and calibration are appropriate.
A fertilizer strip trial needs verified treatment boundaries, application records and a design that addresses spatial variability.
Exposed-soil maps become more informative when linked to slope, drainage concentration and management history.
Pasture mosaics show spatial differences in visible vegetation, bare patches, tracks and shaded ground.
Irrigation problems can appear as localized wet ground, unusual canopy patterns or repeated strips aligned with delivery infrastructure.
Cover-crop mapping should distinguish living vegetation, exposed soil, residue and unobservable shadow.
Vegetable and horticultural beds concentrate plants into narrow production units separated by paths, plastic mulch or irrigation lines.
Vineyard imagery often mixes narrow canopy strips with bright soil, grassed inter-rows and shadows.
No matching articles. Try a broader technical term.